Bladeless Ceiling Fan
One of my ongoing projects is a “bladeless” ceiling fan.
The goal is to design a smart-home fan with the dimensions of a light fixture, but the cooling capability of a full size ceiling fan. It will meet ASHRAE Thermal comfort standards, and even cool large rooms with high ceilings.

The jet is easier to visualize in two dimensions. The clip below shows the fan starting up and approaching steady state over approximately one second.
A cross-section of the airflow in a room shows how the jet from the fan generates recirculating flow. This will eventually propagate through the entire room.
As part of the exercise, I automated a CFD process that resolves the full rotation of the fan blades. The virtual rotation captures the interaction of the blades and air that produces noise.
The next step to complete the mechanical design and incorporate smart-home features (connectivity, quality speakers, controllable LEDs).
Options Database: Tracking and Plotting
With all the hype surrounding retail trading, I wanted to learn more about the finance world. I’m particularly interested in the technical aspects of the market, and the wave of technology that has entered finance in the last few decades.
Options in particular have become popular amongst retail traders. Some are taking on risk and leverage previously unheard of for amateur traders (perhaps sometimes unbeknown to them).
I started tracking options data in February 2021. Three times per day I query the options chain for the 25 highest volume stocks, and store the data in a Mongo database.
Some examples of data collected
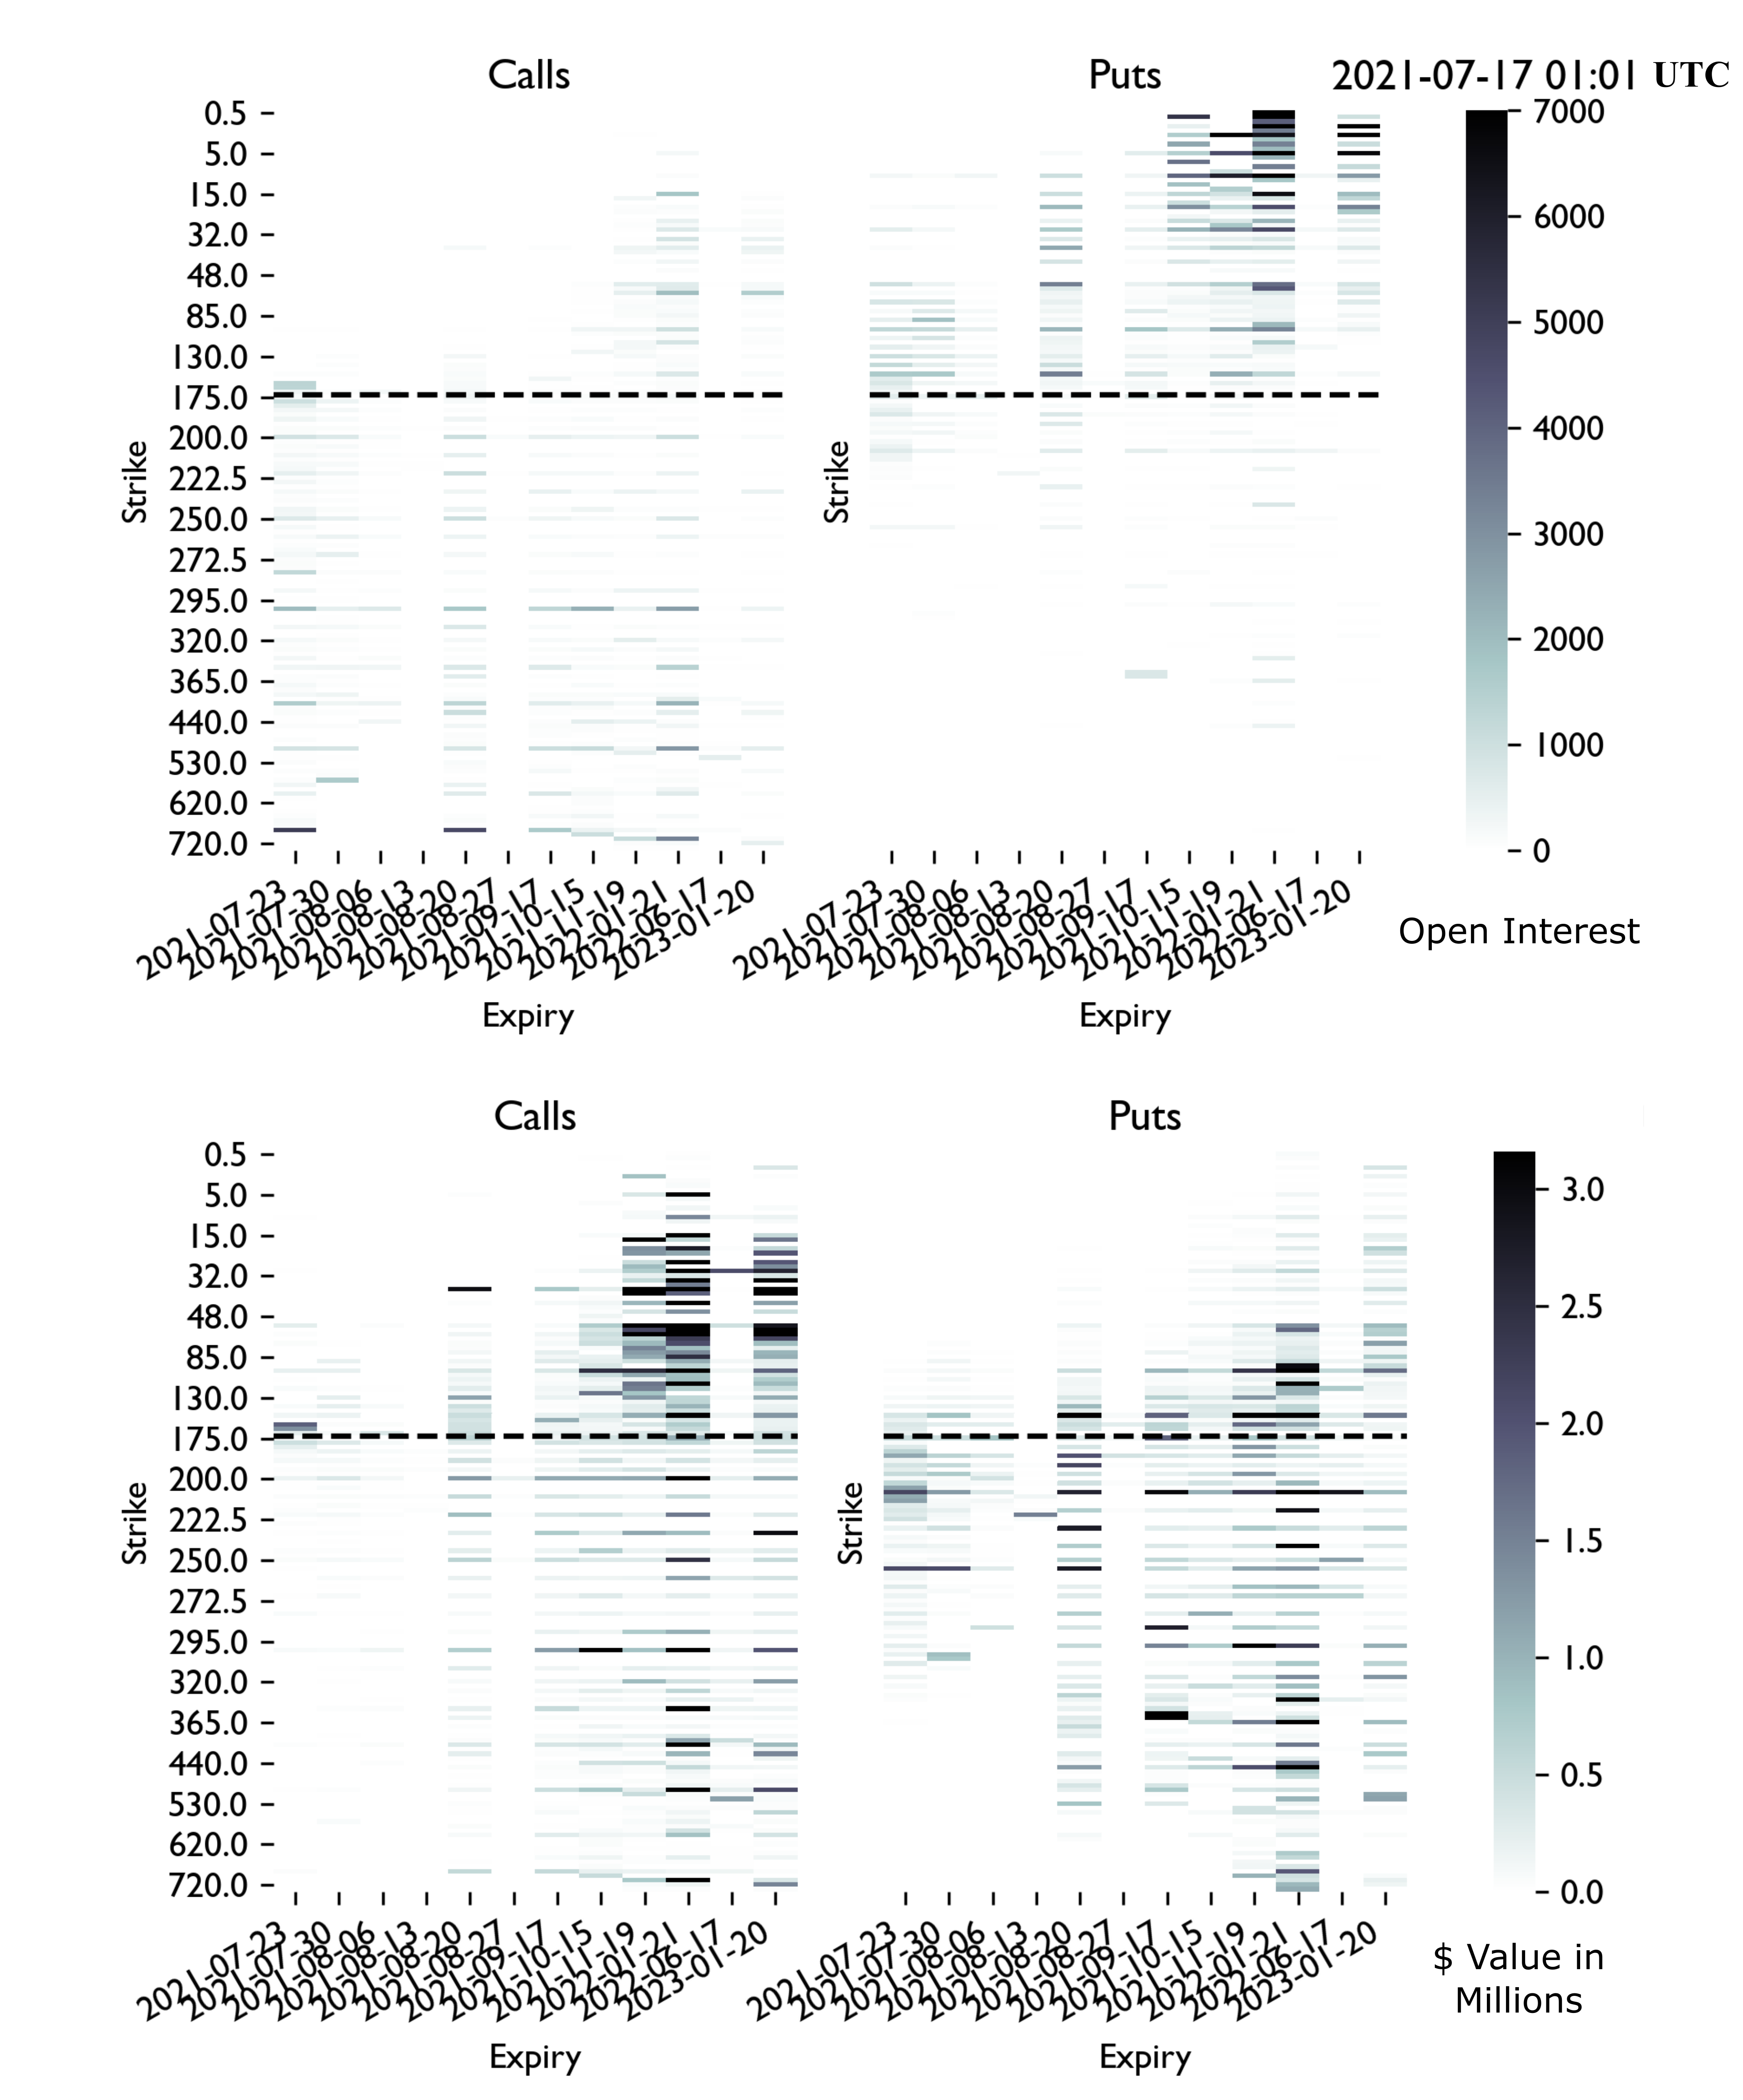
The frantic buying and selling of extremely risky GameStop options was front page news. Out of curiosity, I started plotting open interest to see what contracts were being bought and sold.
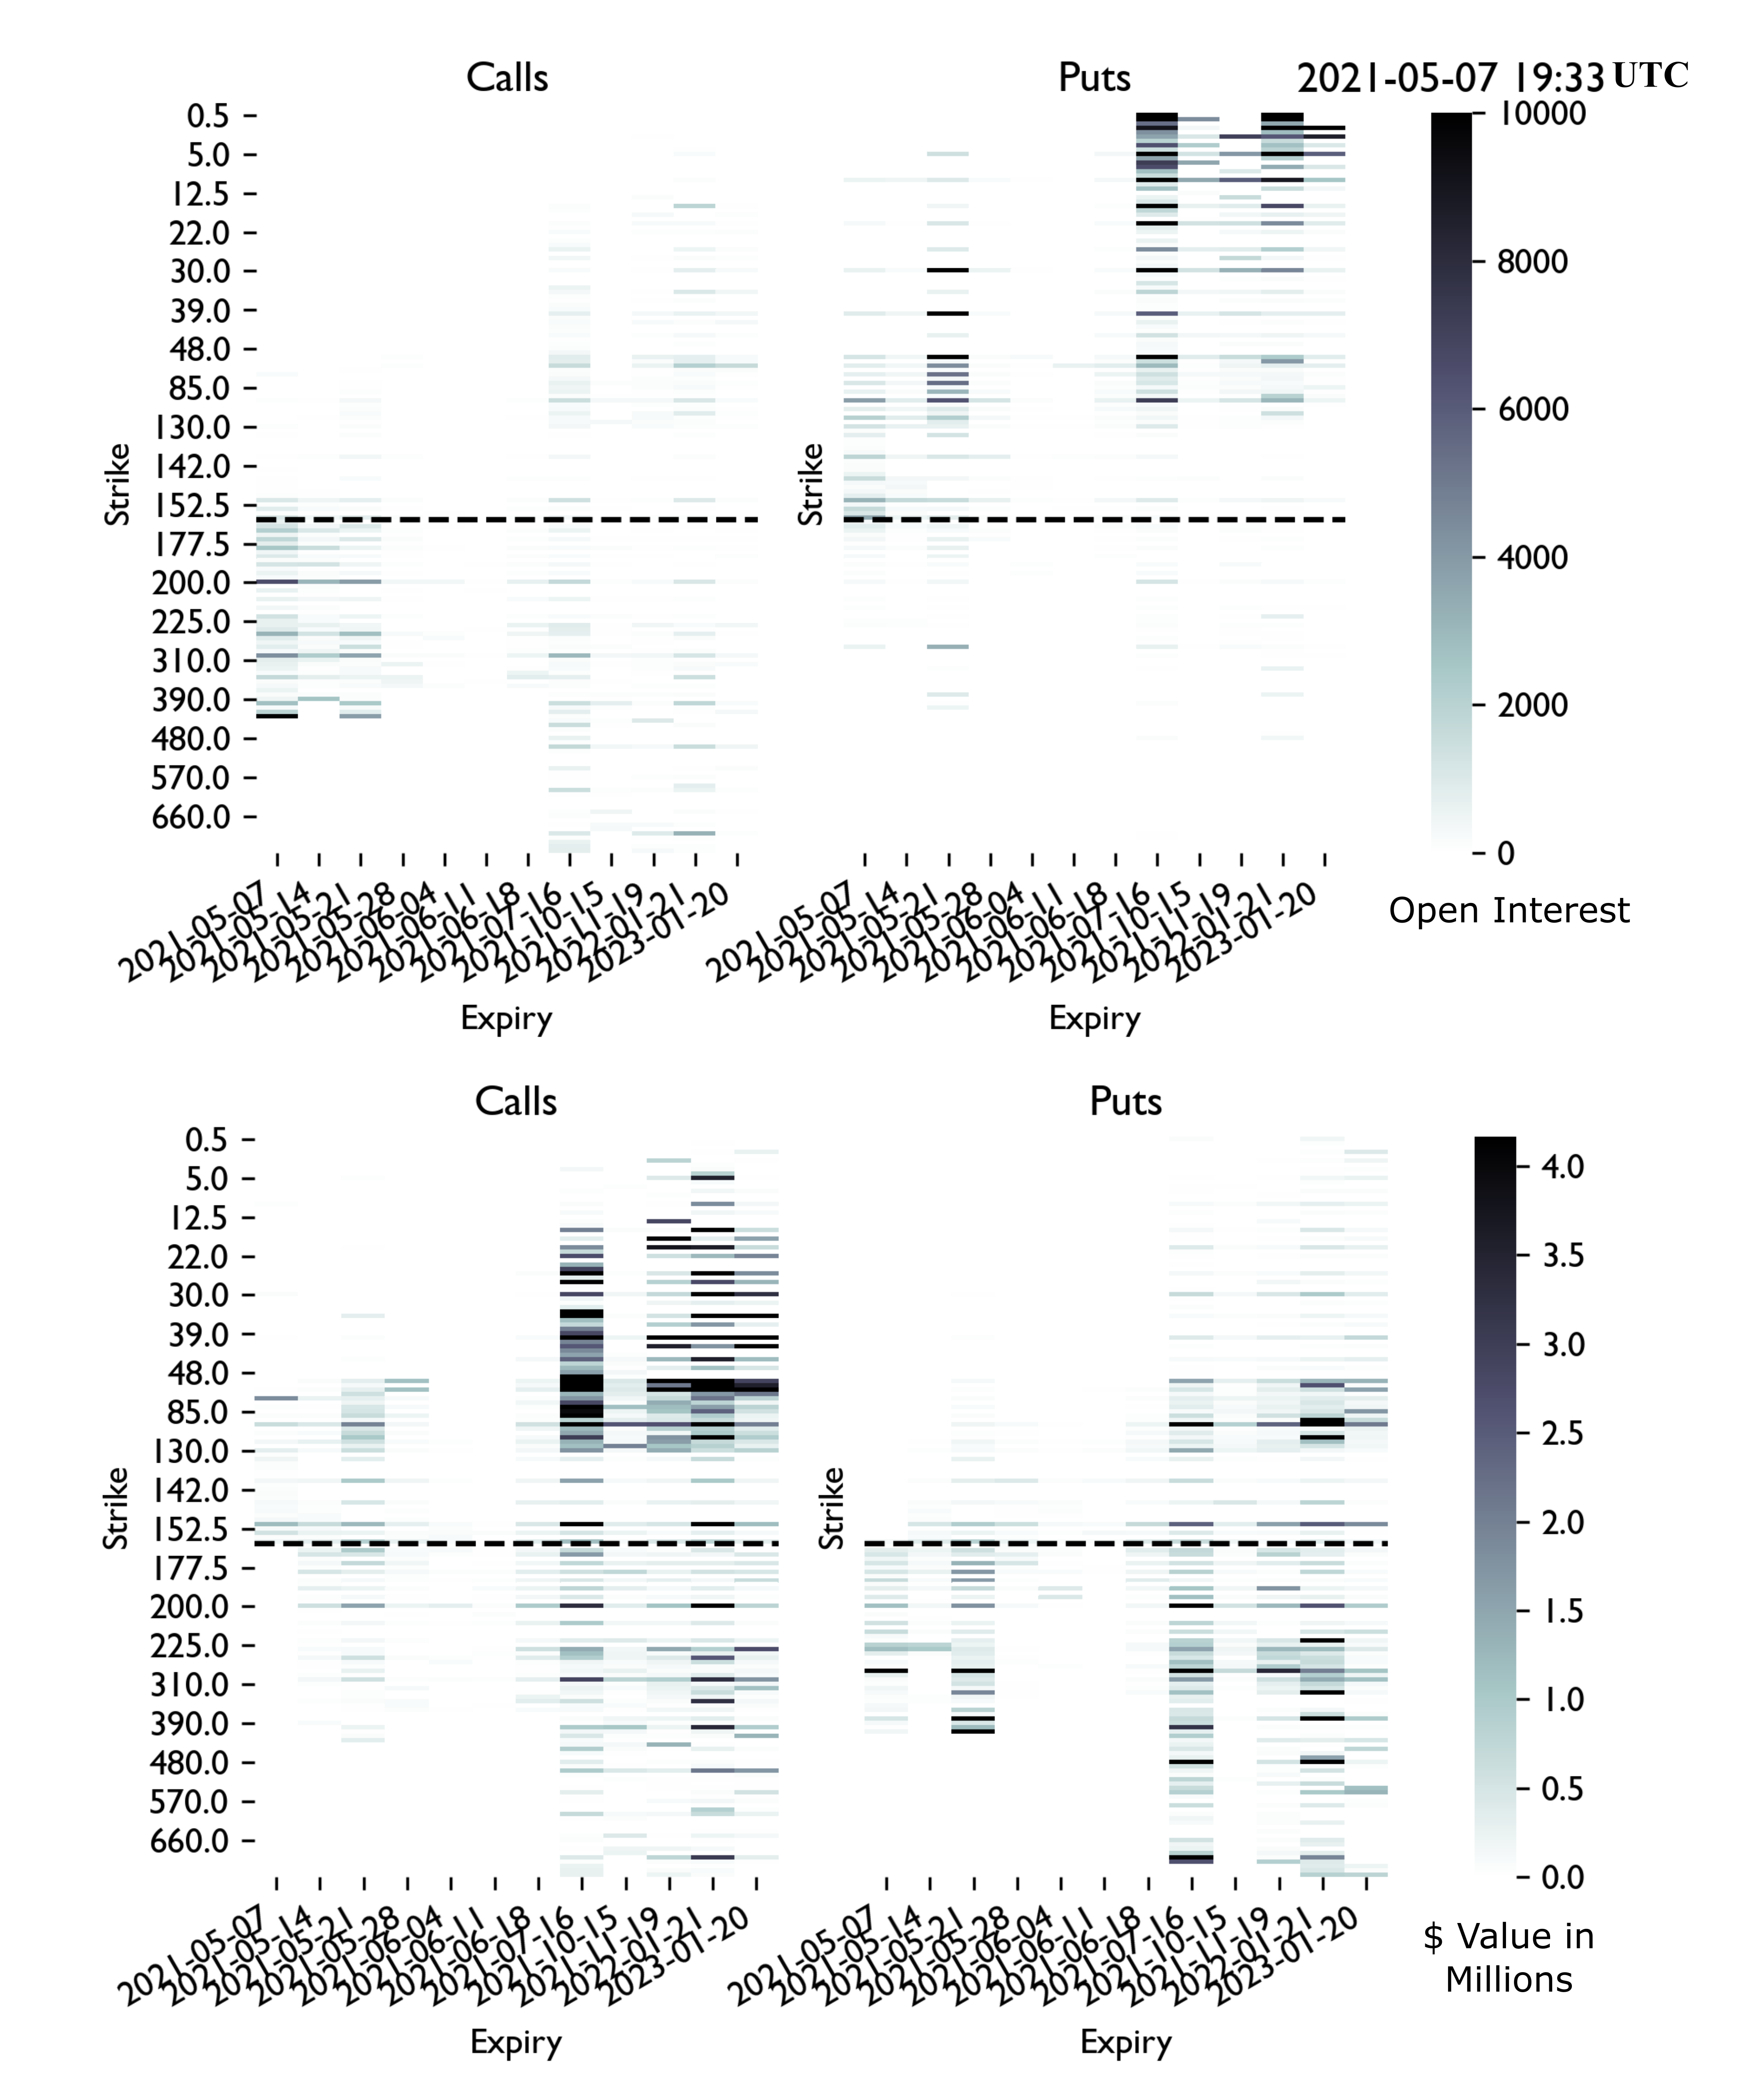
Surprisingly, most of the open interest was in far out of the money put options. This seems to go against popular sentiment.
Perhaps these puts are being bought/sold in a basket to meet some targeted exposure to price movement or volatility? Maybe they are just being sold naked due to massive implied volatility? Regardless, speculating was an interesting exercise.
The contracts in the money are unsurprisingly most valuable, but there still was (and still is) 10s of millions in out of the money contracts. These patterns have held for nearly 6 months.
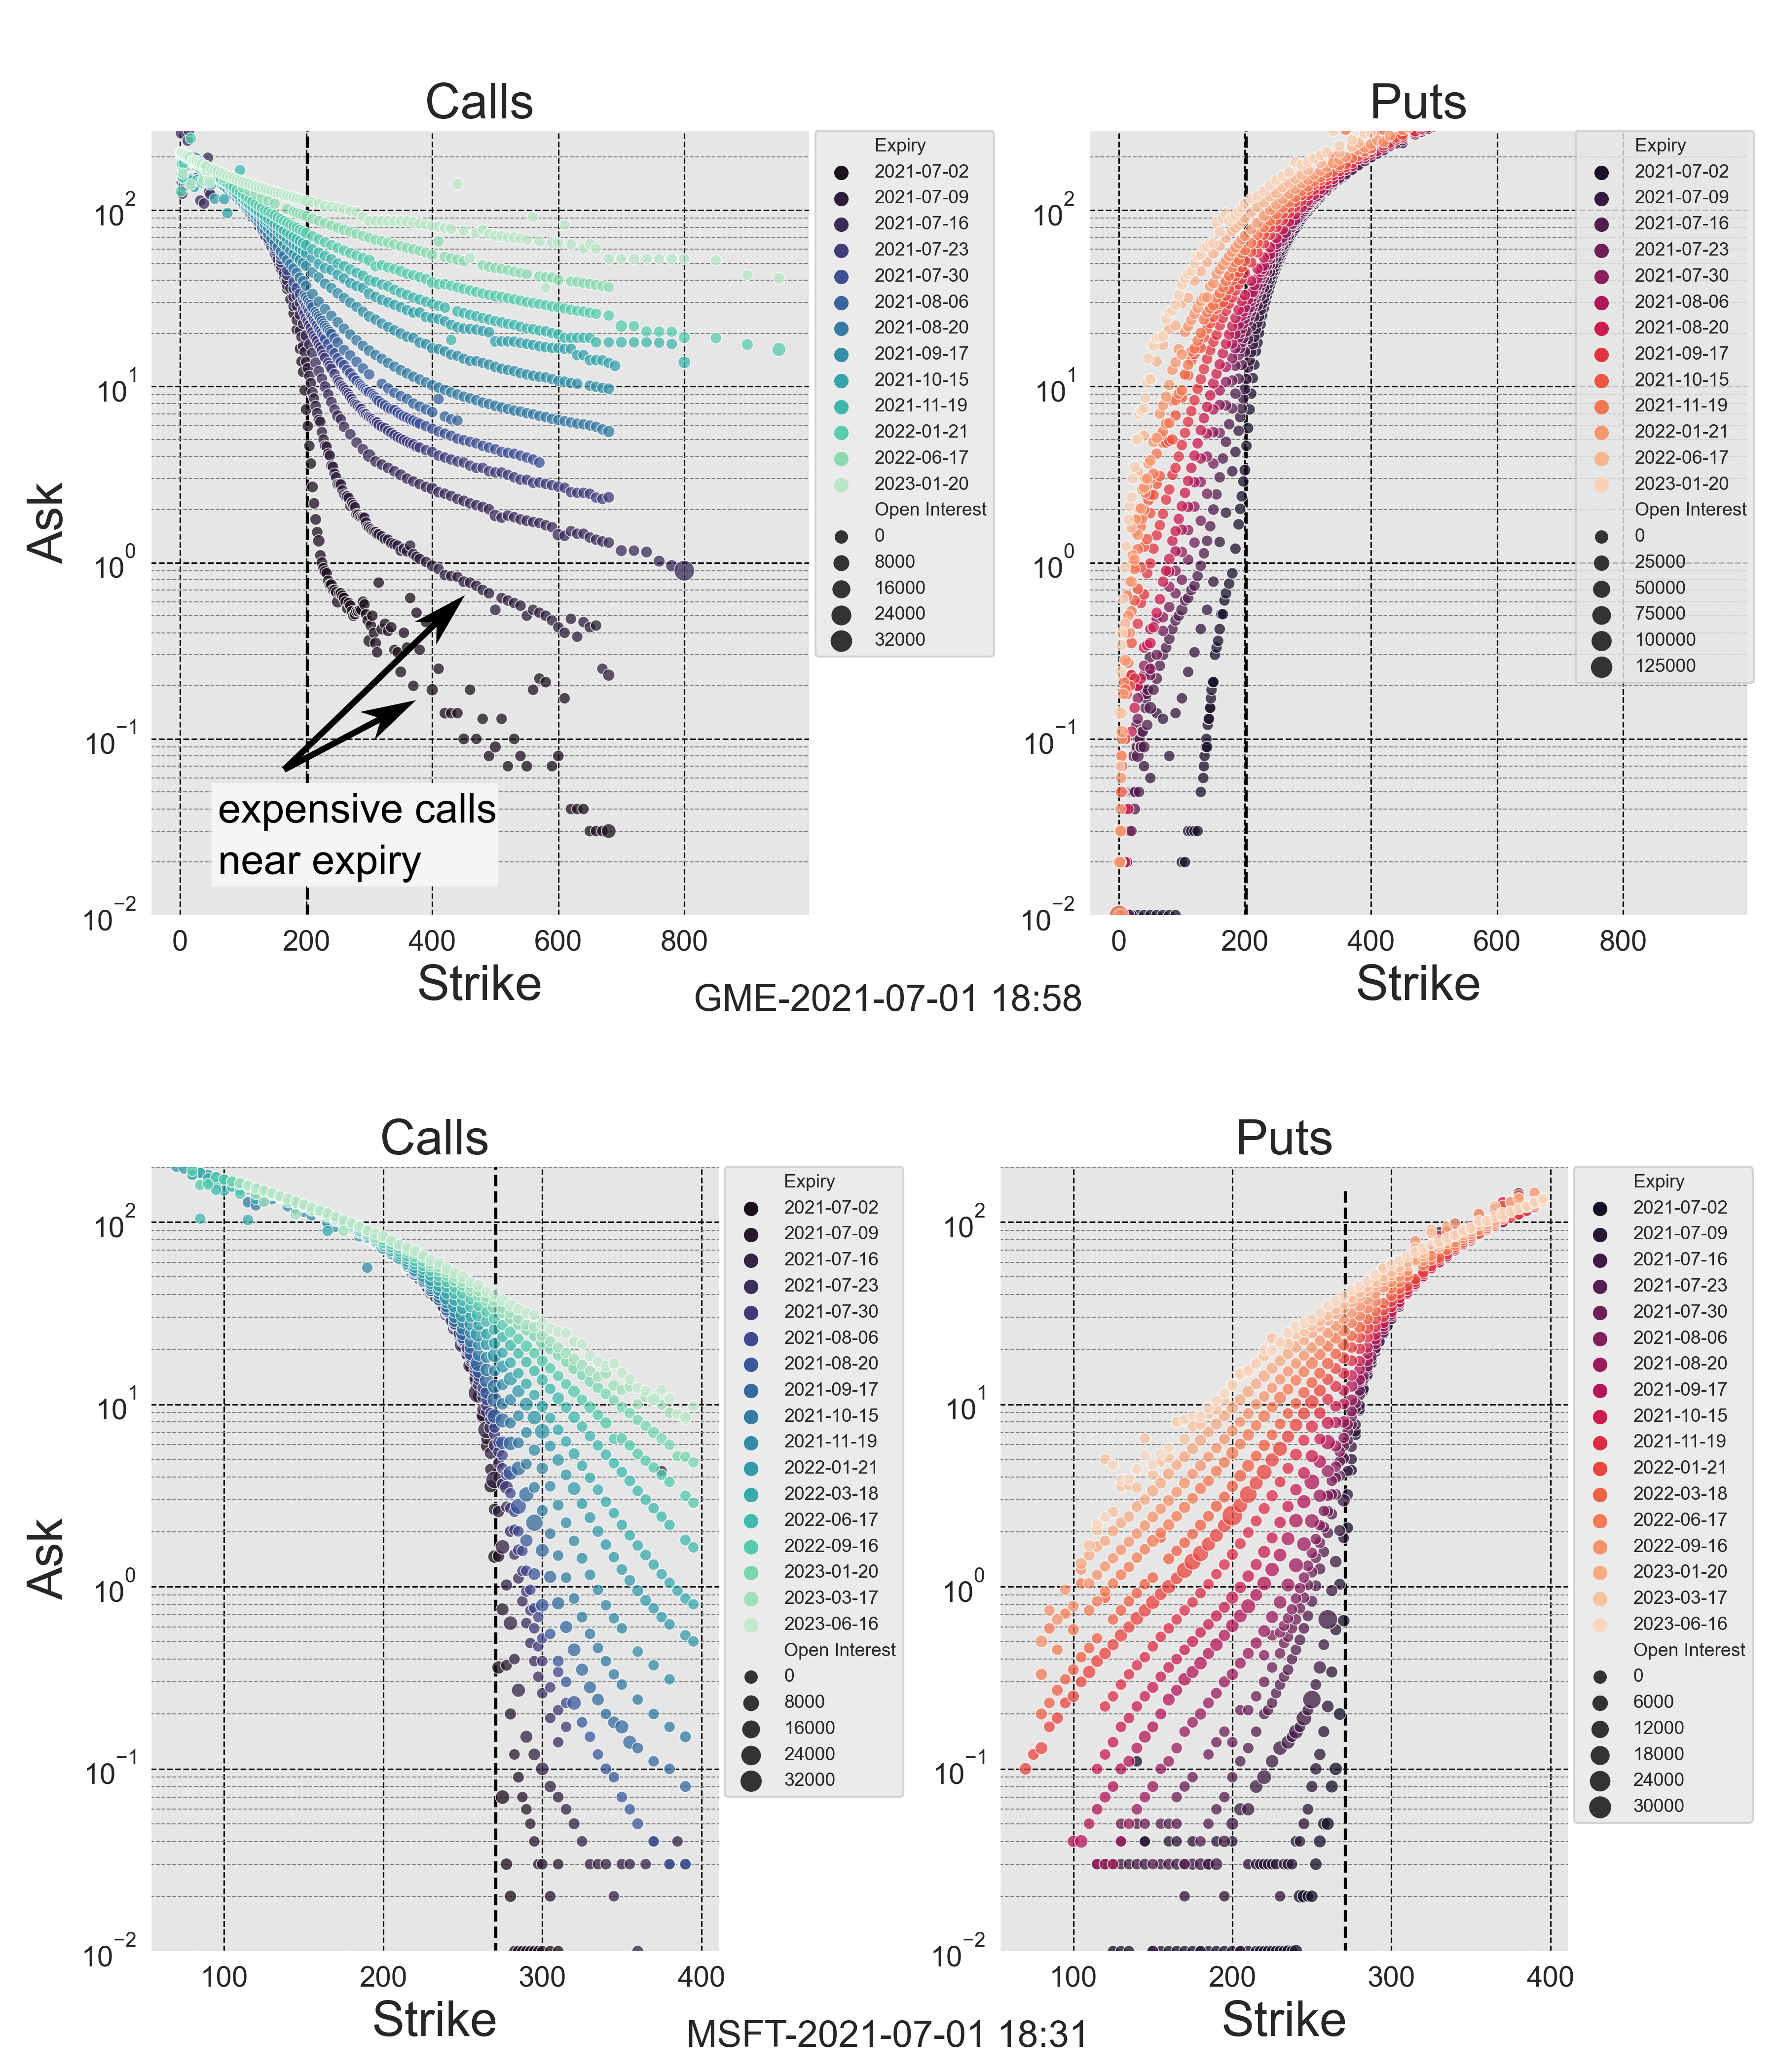
Comparing GME to the far less volatile MSFT clearly shows the effect of volatility on the prices of high-strike calls near expiry.
Implied volatility is plotted below (taken at face value from Yahoo finance, guessing just Black-Scholes). The order of magnitude difference in implied volatility further emphasizes the difference in the Ask-price vs strike curve near expiry.
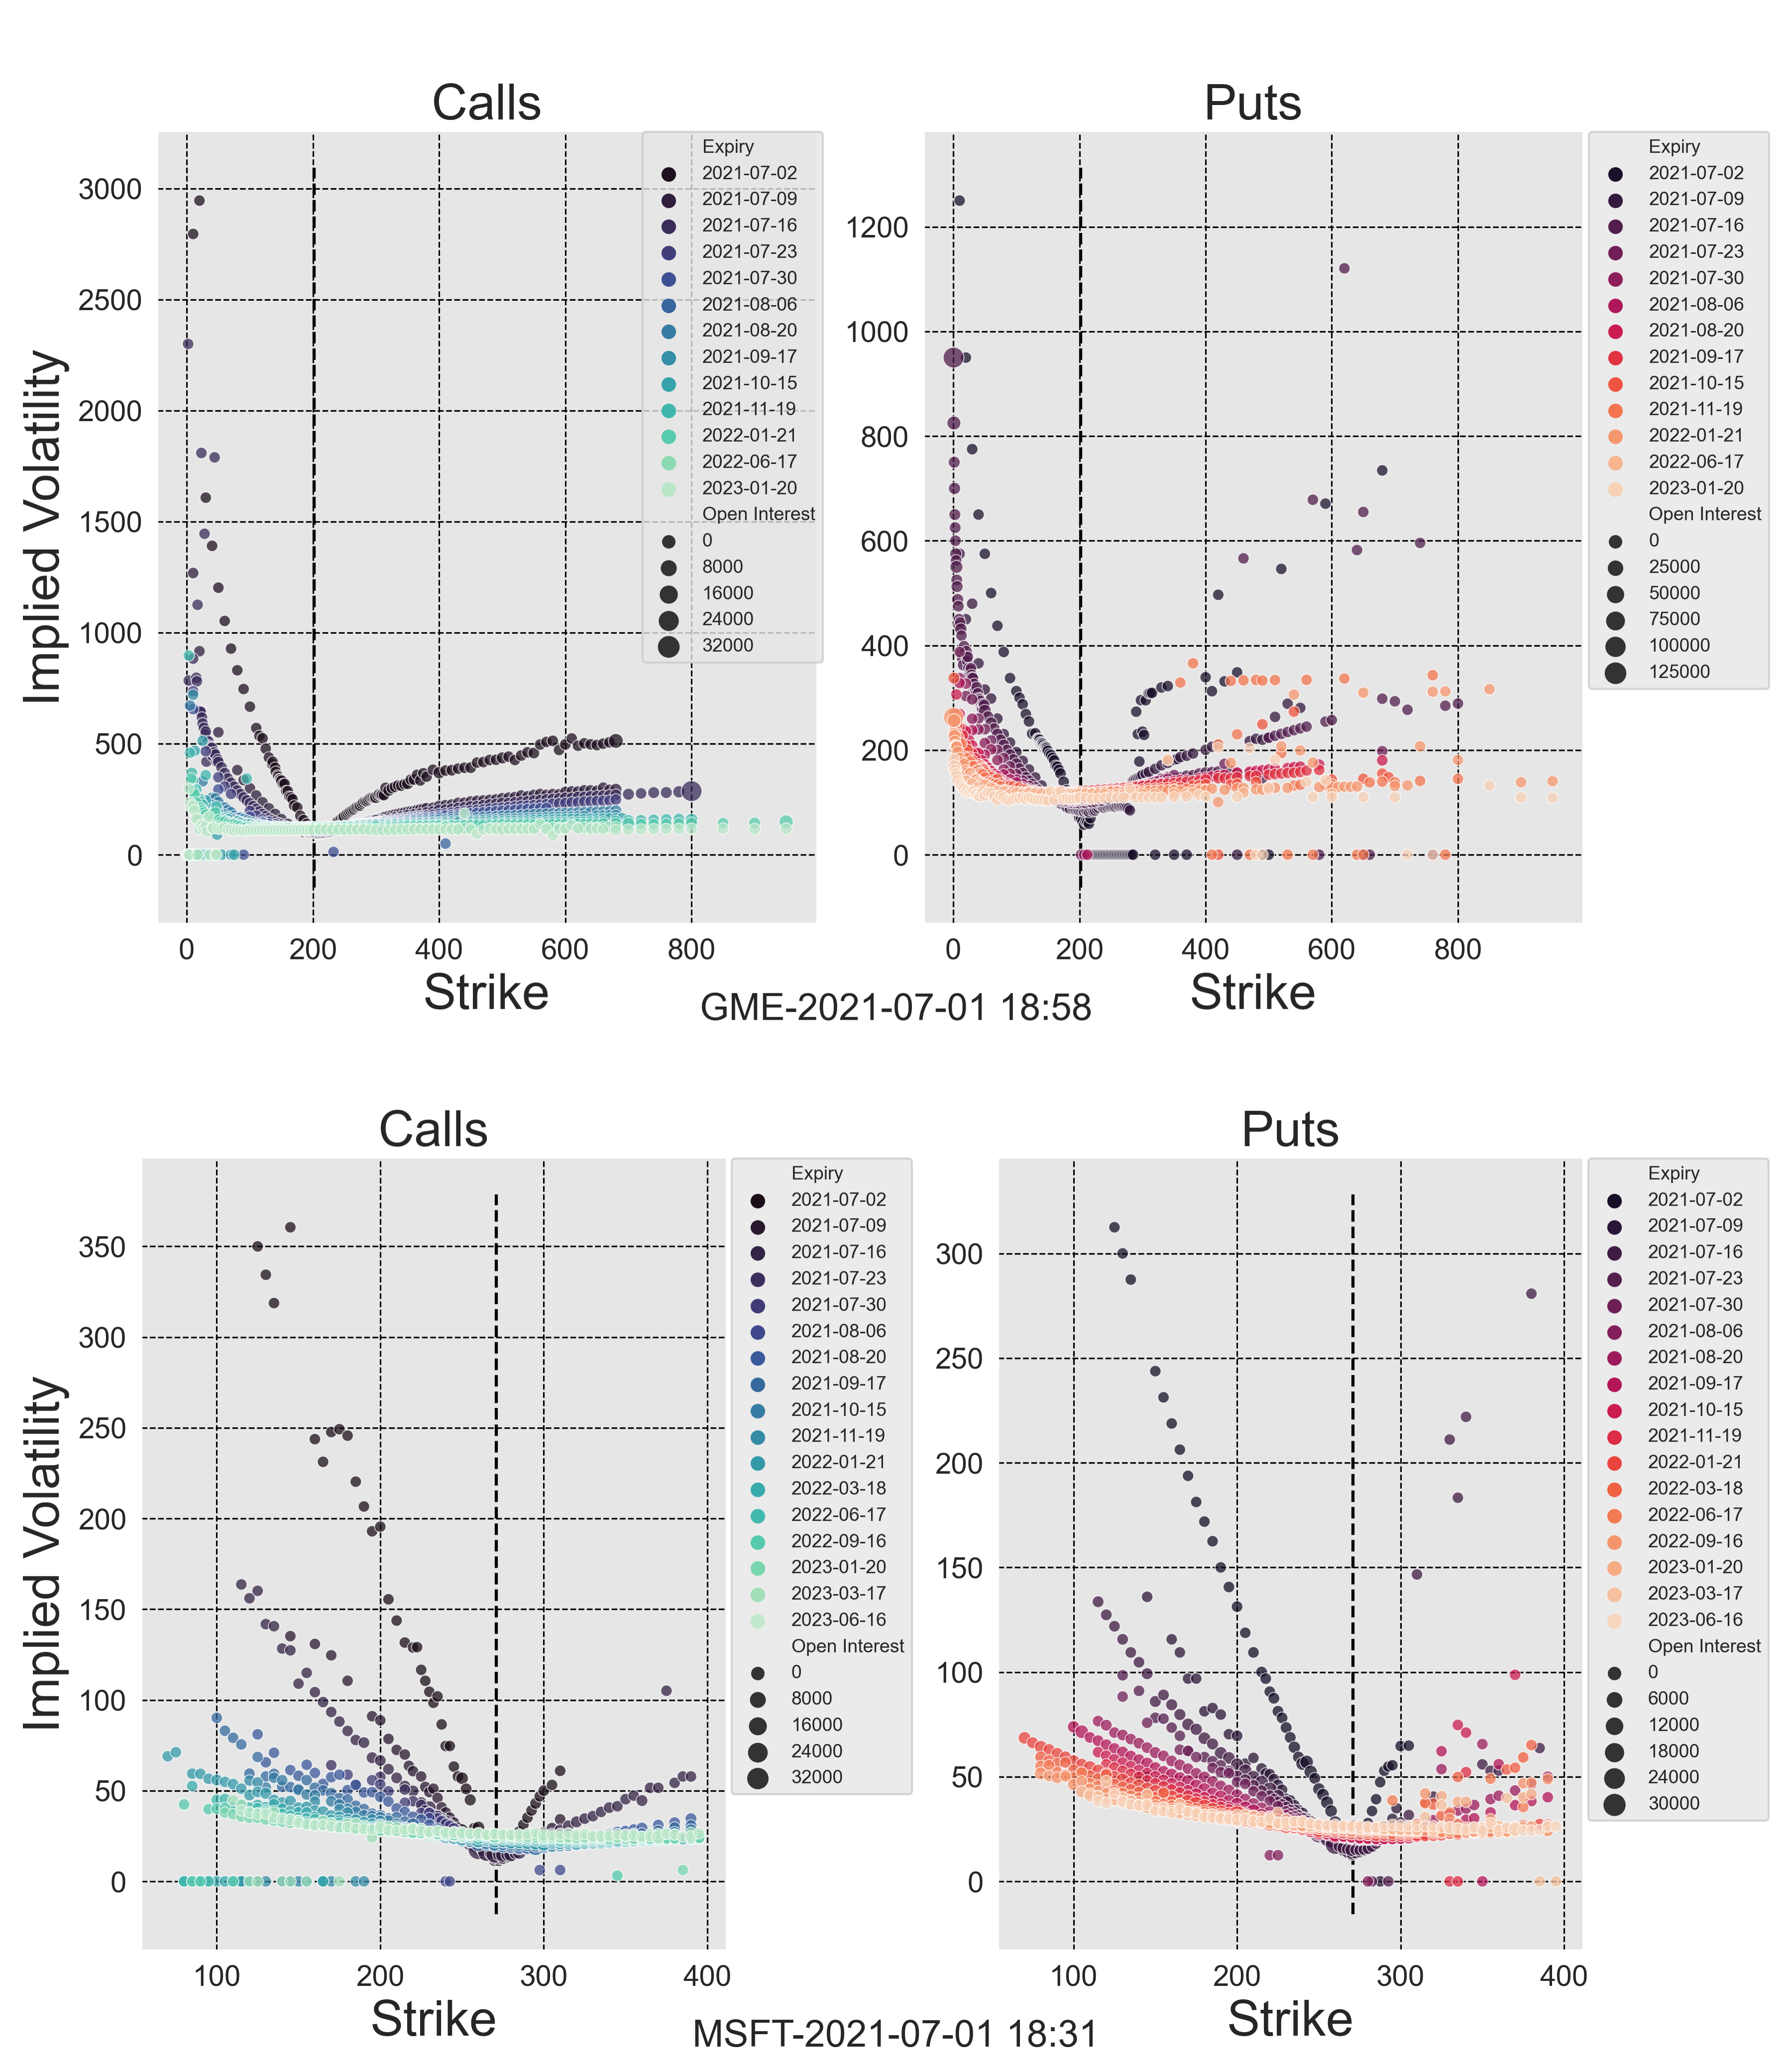
Implied volatility is calculated from option pricing models. Some models assume assume volatility is equal for all options expiring on the same date. The above shows this clearly not to be true.
The more extreme strike prices are more ‘in-demand’ than a model like Black-Scholes models would predict. This could be due to better models being widely used, or due to people hedging against large price movements.
Some models are based on a normal distribution of the underlying stock price, and therefore may under-predict the likelihood of extreme price movements. Mathematicians such as Benoît Mandelbrot have implied that ‘fat-tailed’ distributions are more appropriate.
Learning a small bit about the world of quantitative finance has only created more questions for me, and the options tracking project is still on-going. My next step is to build a dashboard using Plotly Dash.
I also want to develop tools to plot frequency response of stock prices. I have been trying to think of novel ways to utilize the spectral content of price data, and use some of the correlation tools I’ve applied in fluid experiments.
Methods Development Model: Formula SAE Chassis
I have an OpenFoam installation on my home server, and to I wanted to create an automated work flow. I also wanted some example geometry to test newer features and solvers. Therefore, I needed some CFD ready CAD to use as a test bench. To meet these needs, I drew a formula SAE car starting with some old surfaces from my undergraduate days.
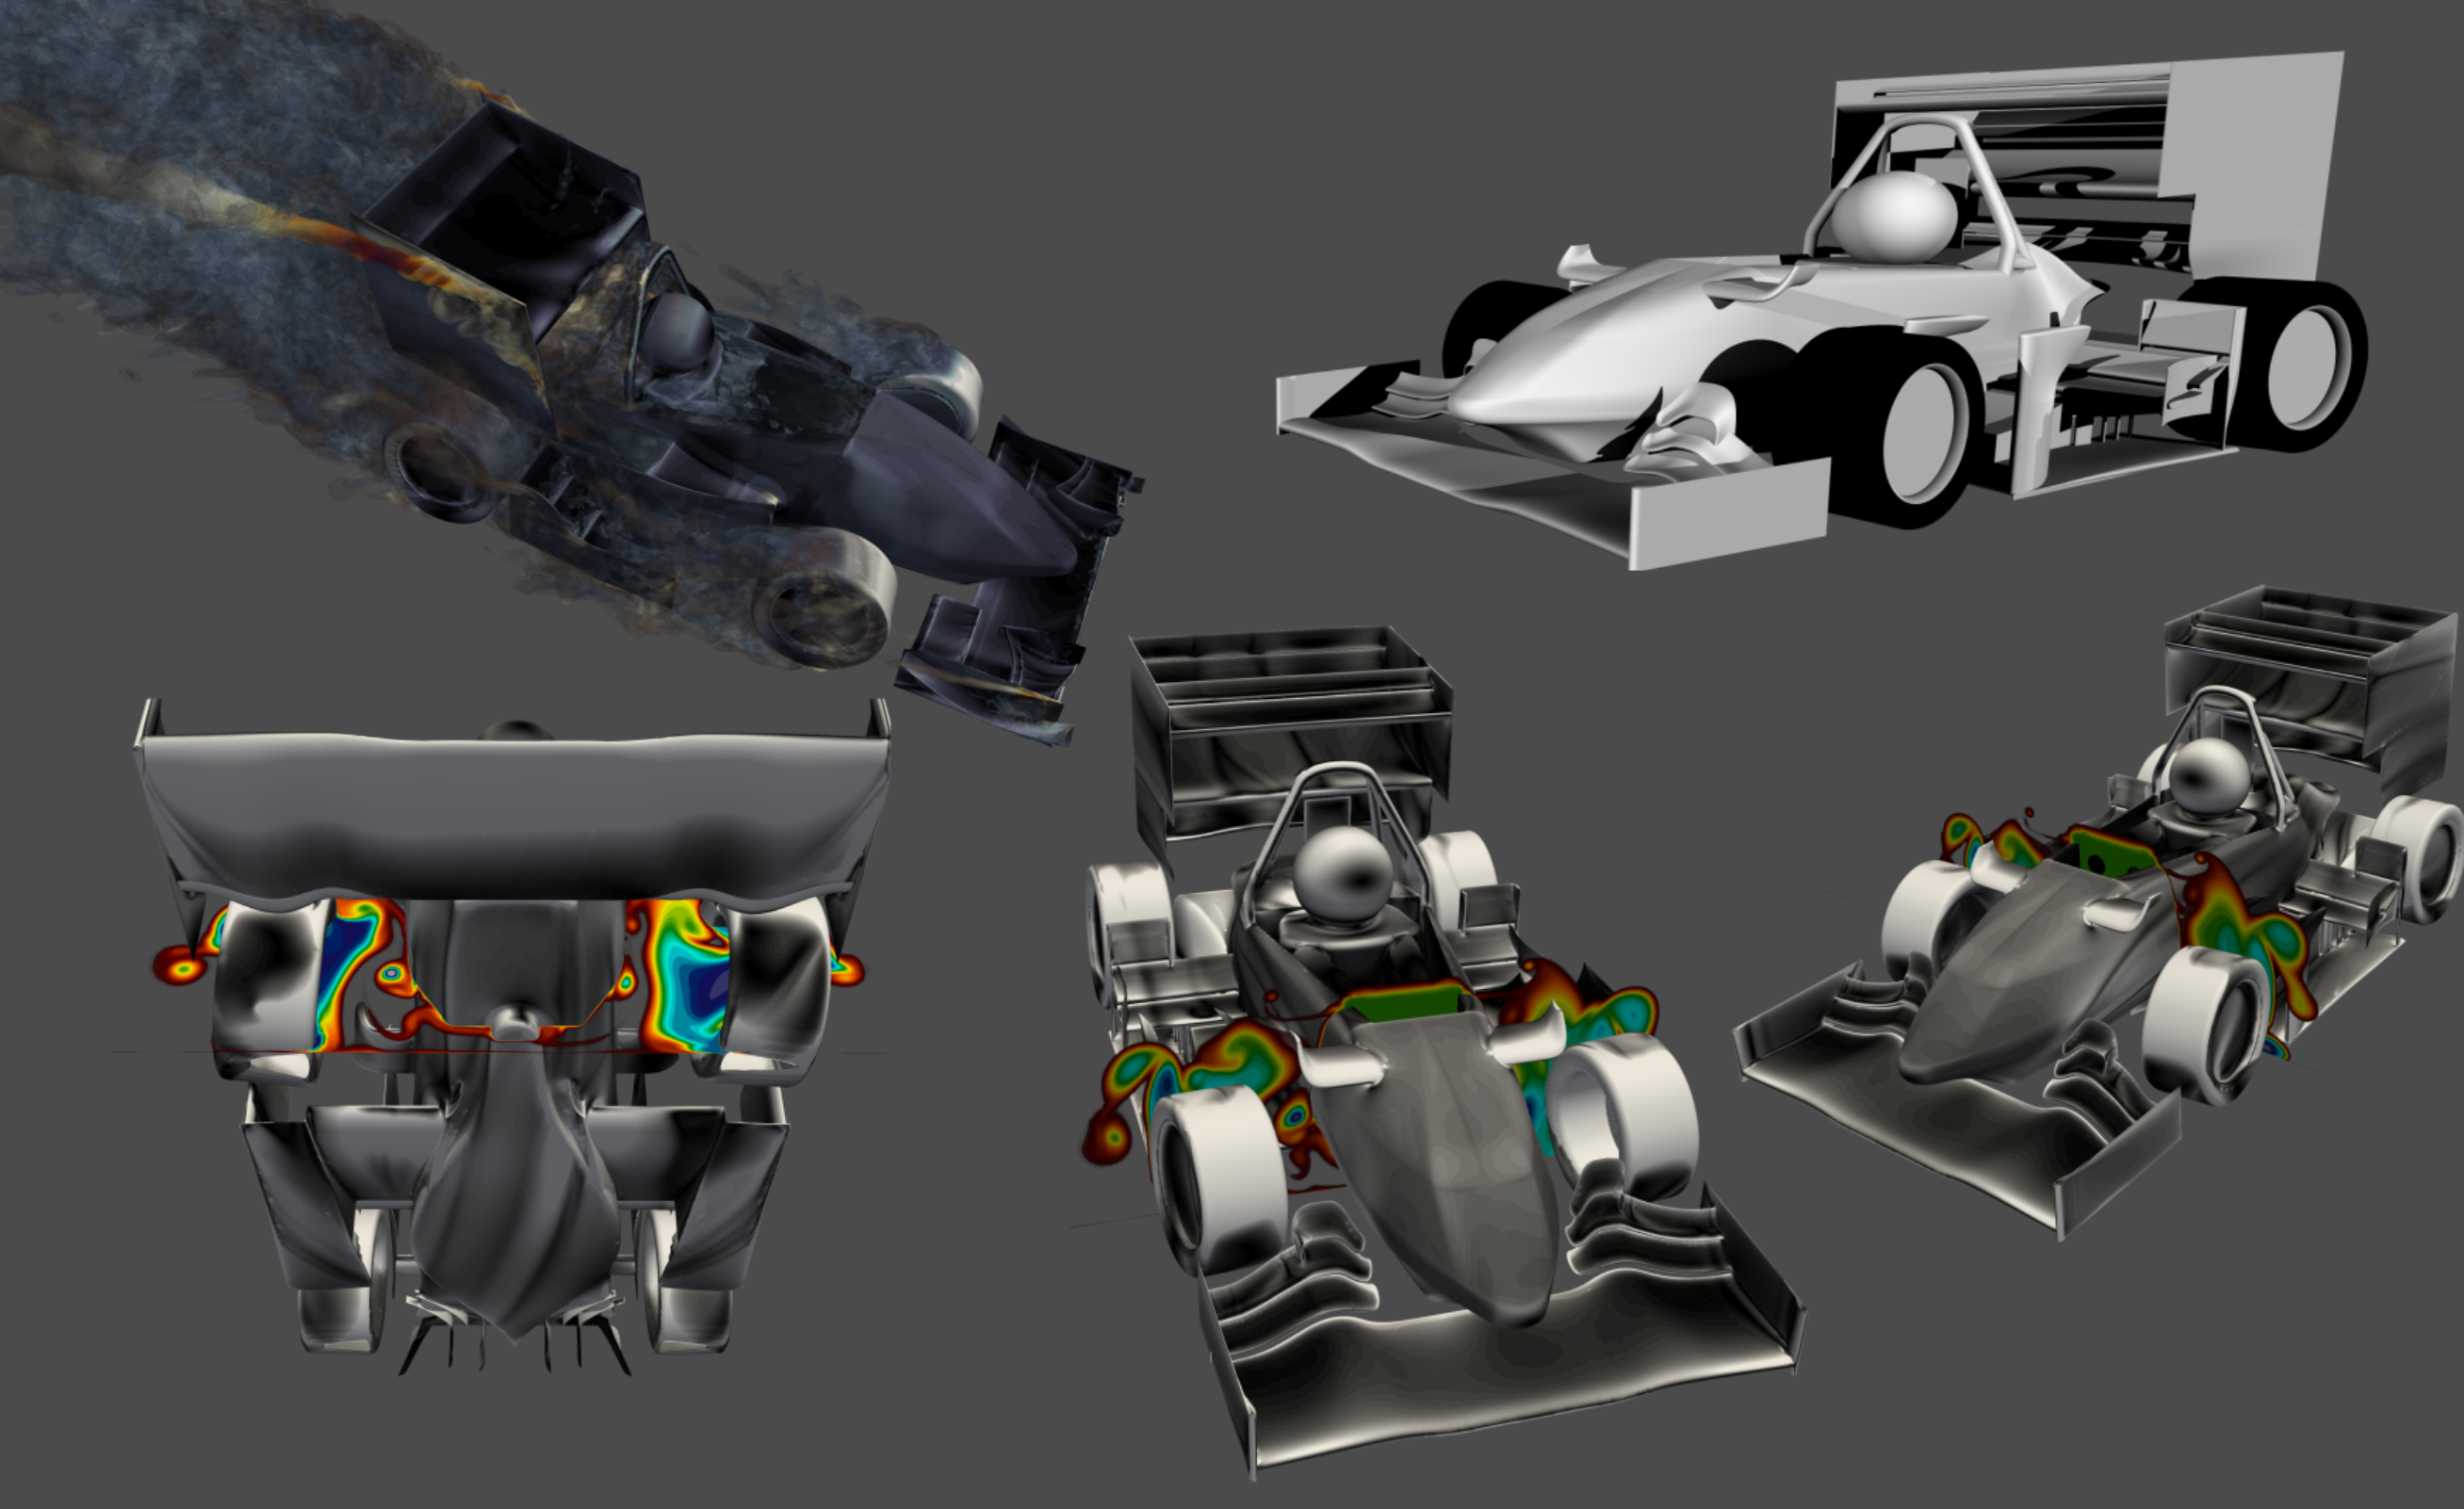
I have tested different turbulence models and automation scripts with this geometry, but quickly switched to the bladeless fan project once I had a satisfactory setup.
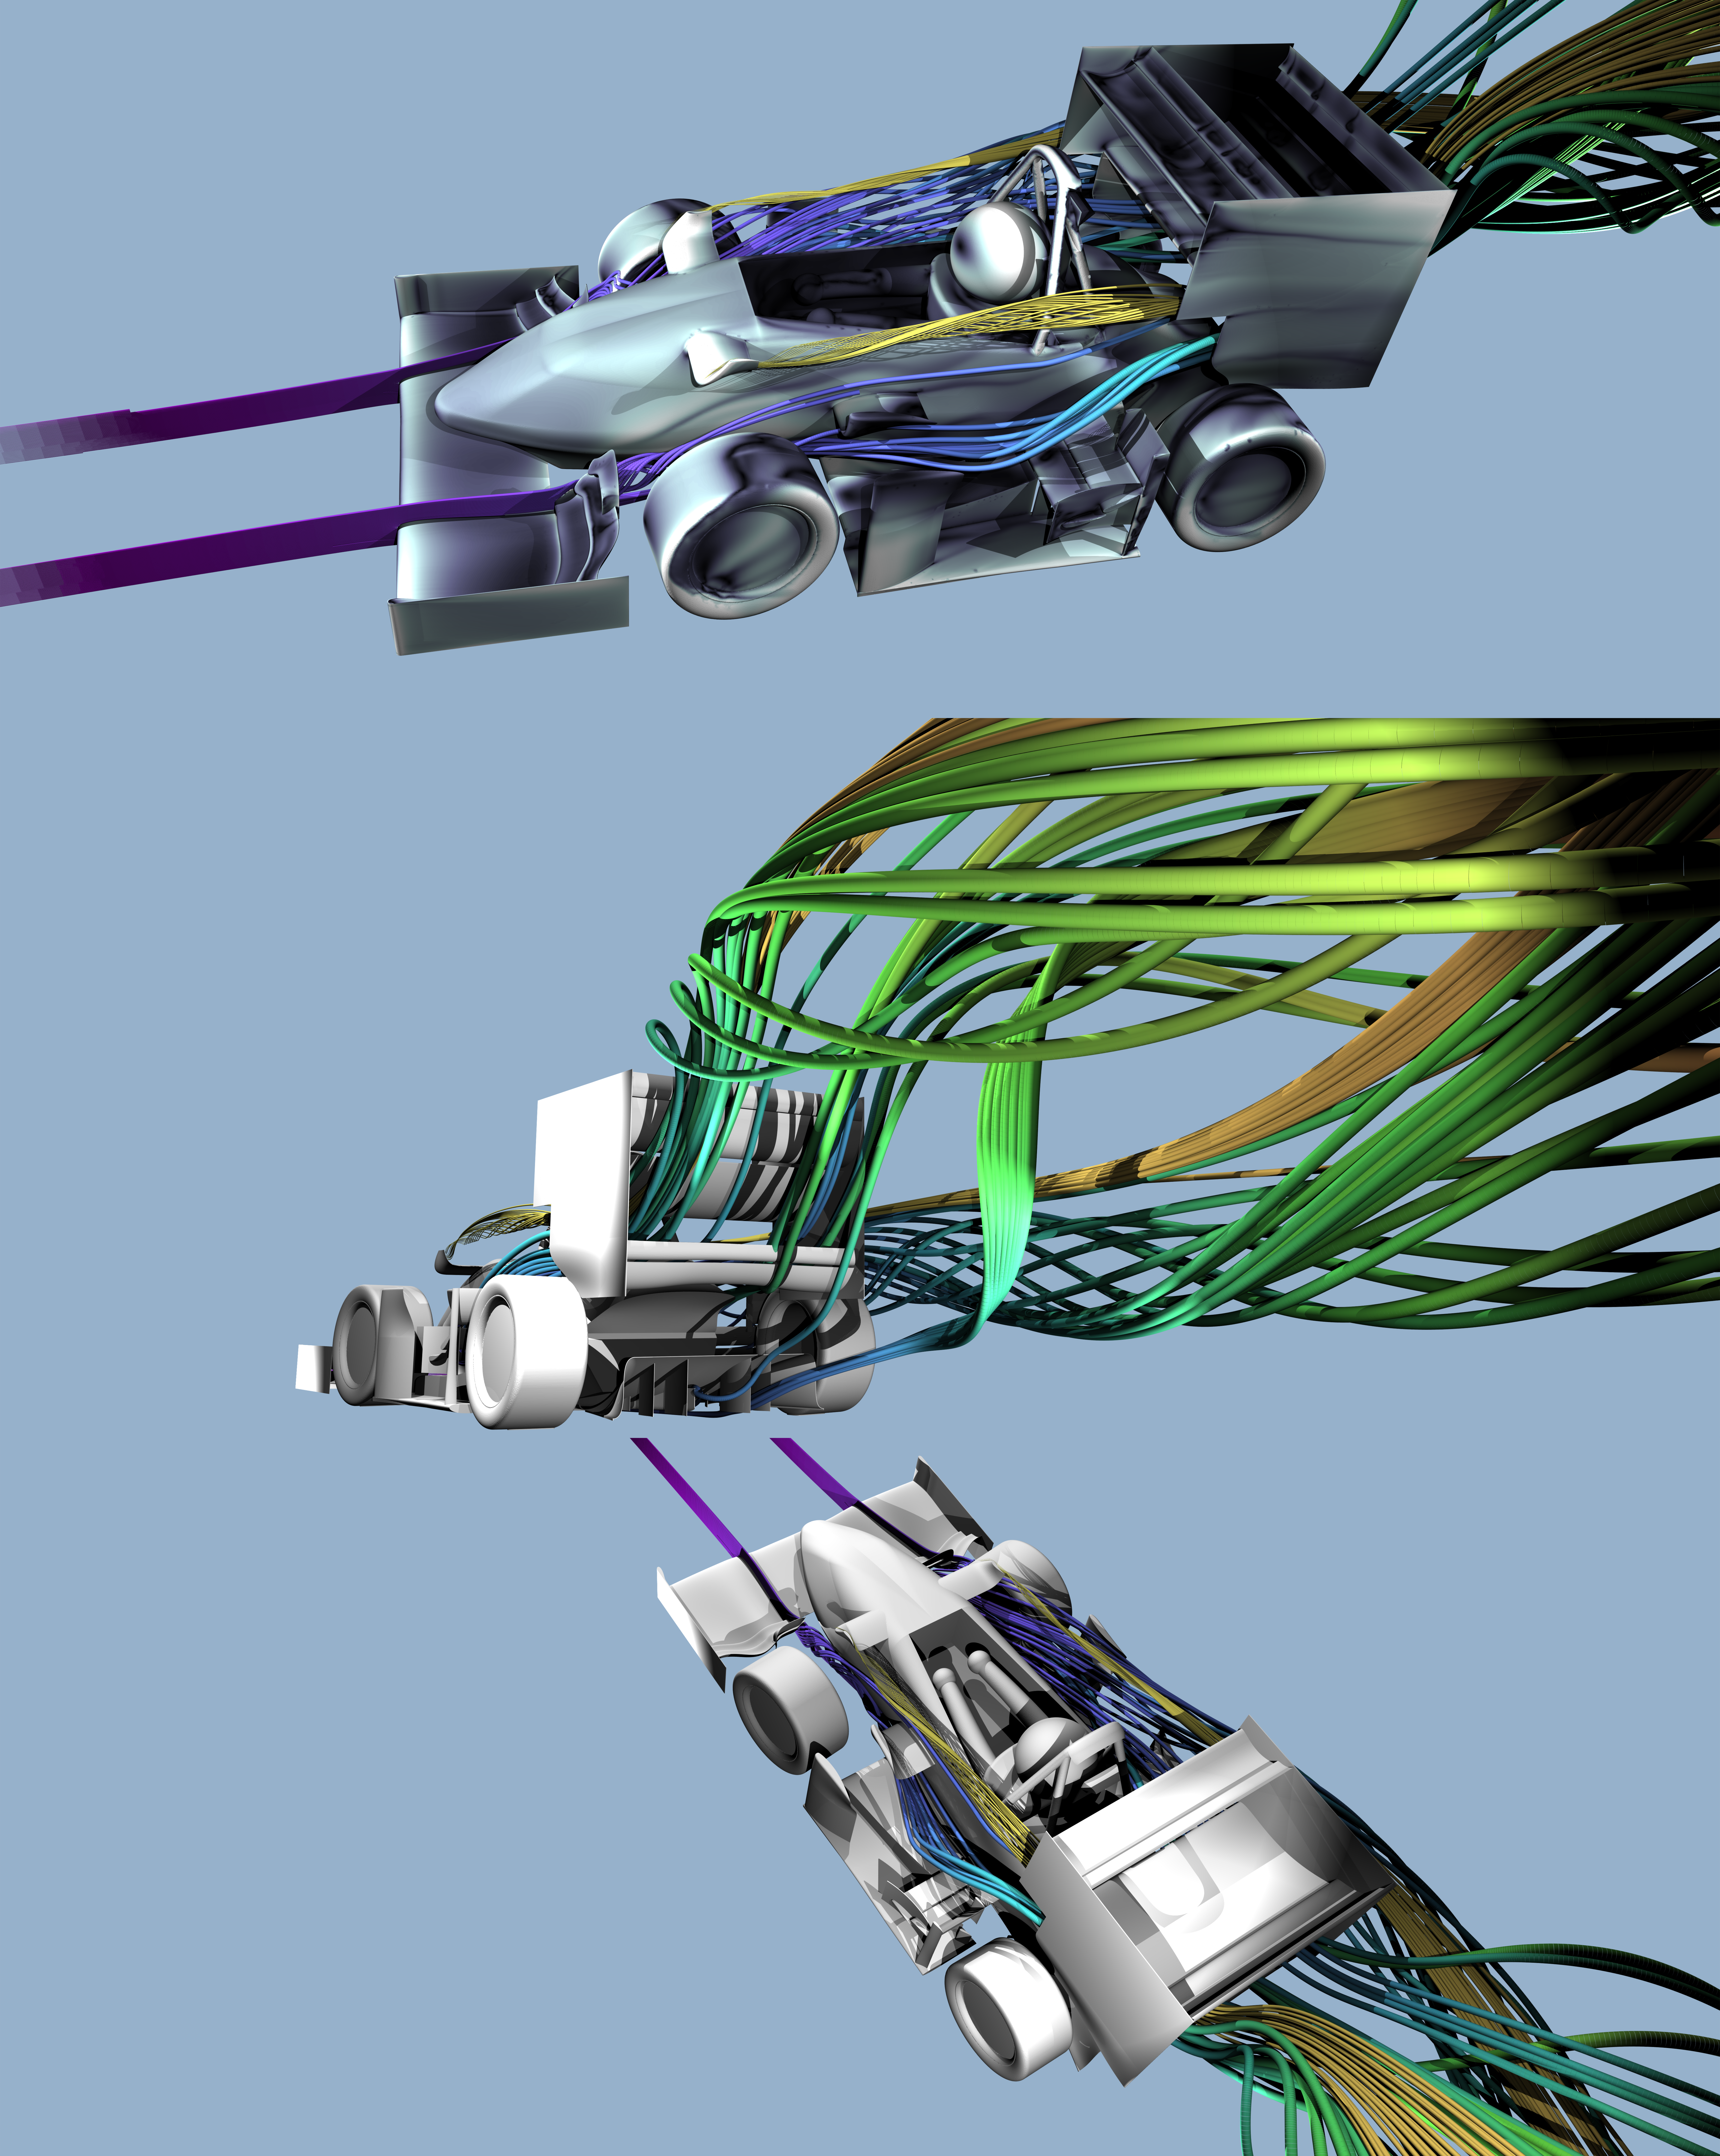
Purely for aesthetic purposes, I made some plots that show the flow structures around the car.
Even more visually striking are the resolved turbulent structures from testing DDES models.
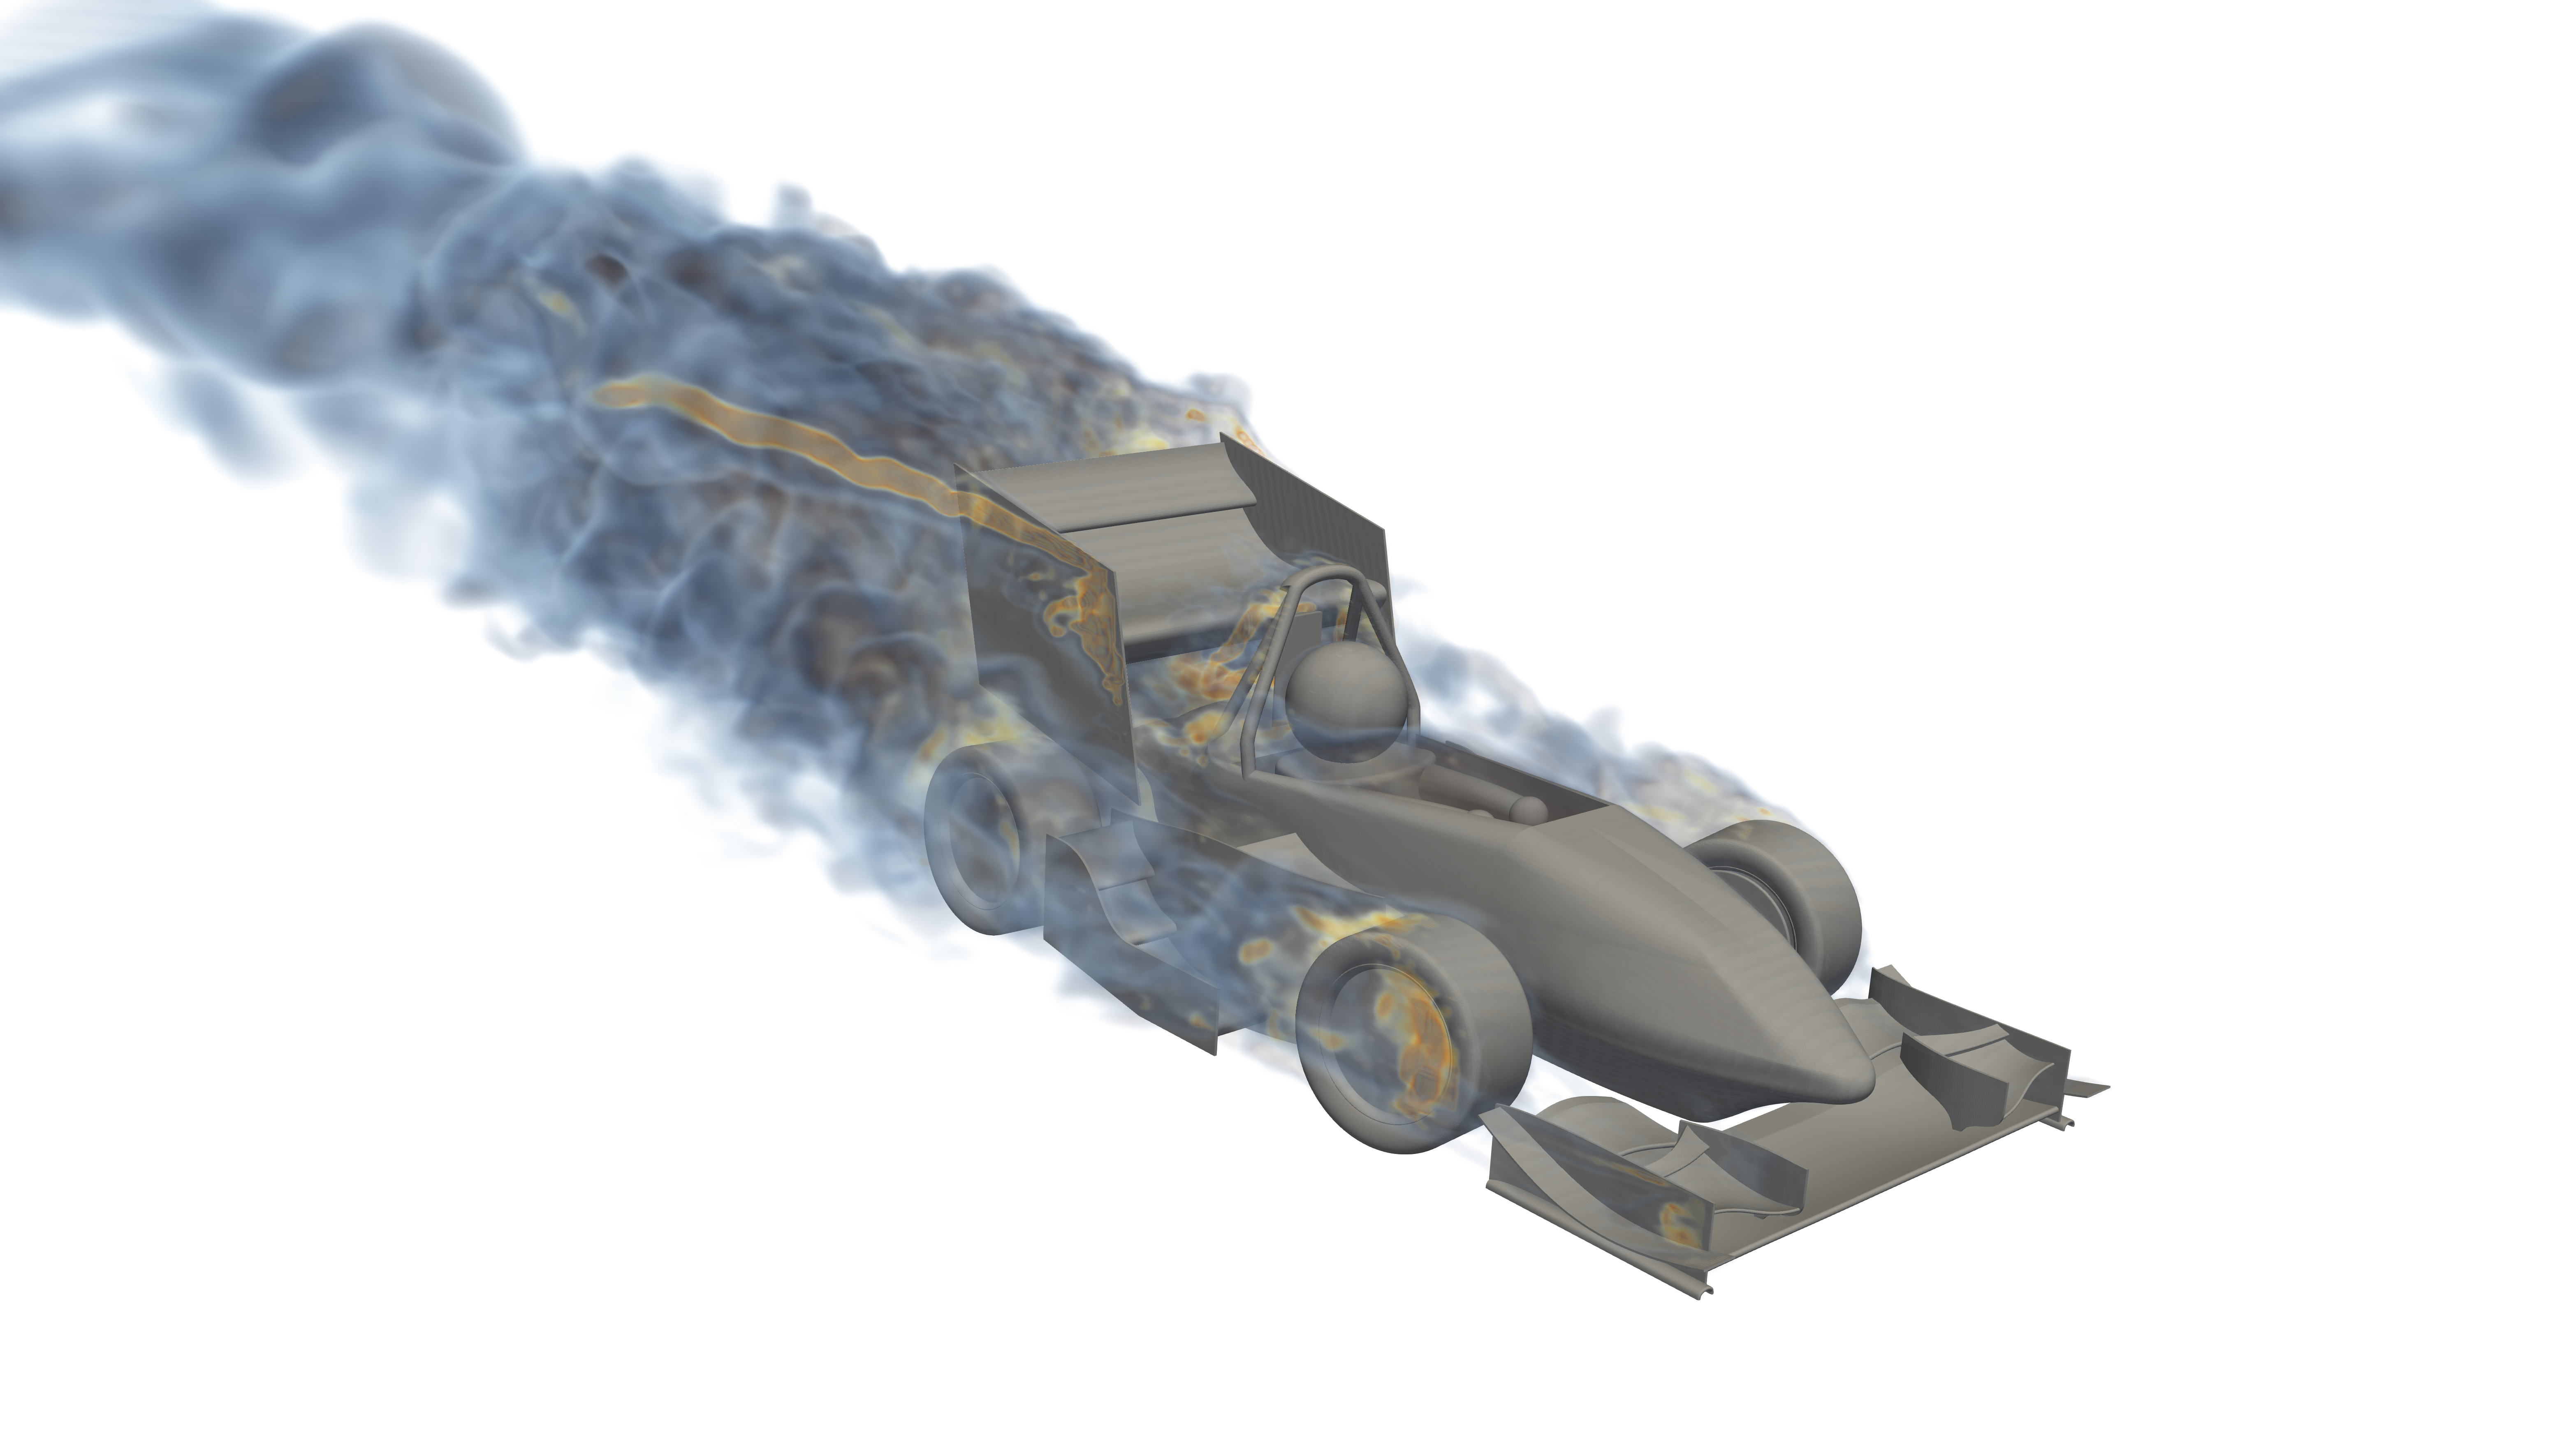
Video shows the structures in motion (watch in full 4K for best effect):
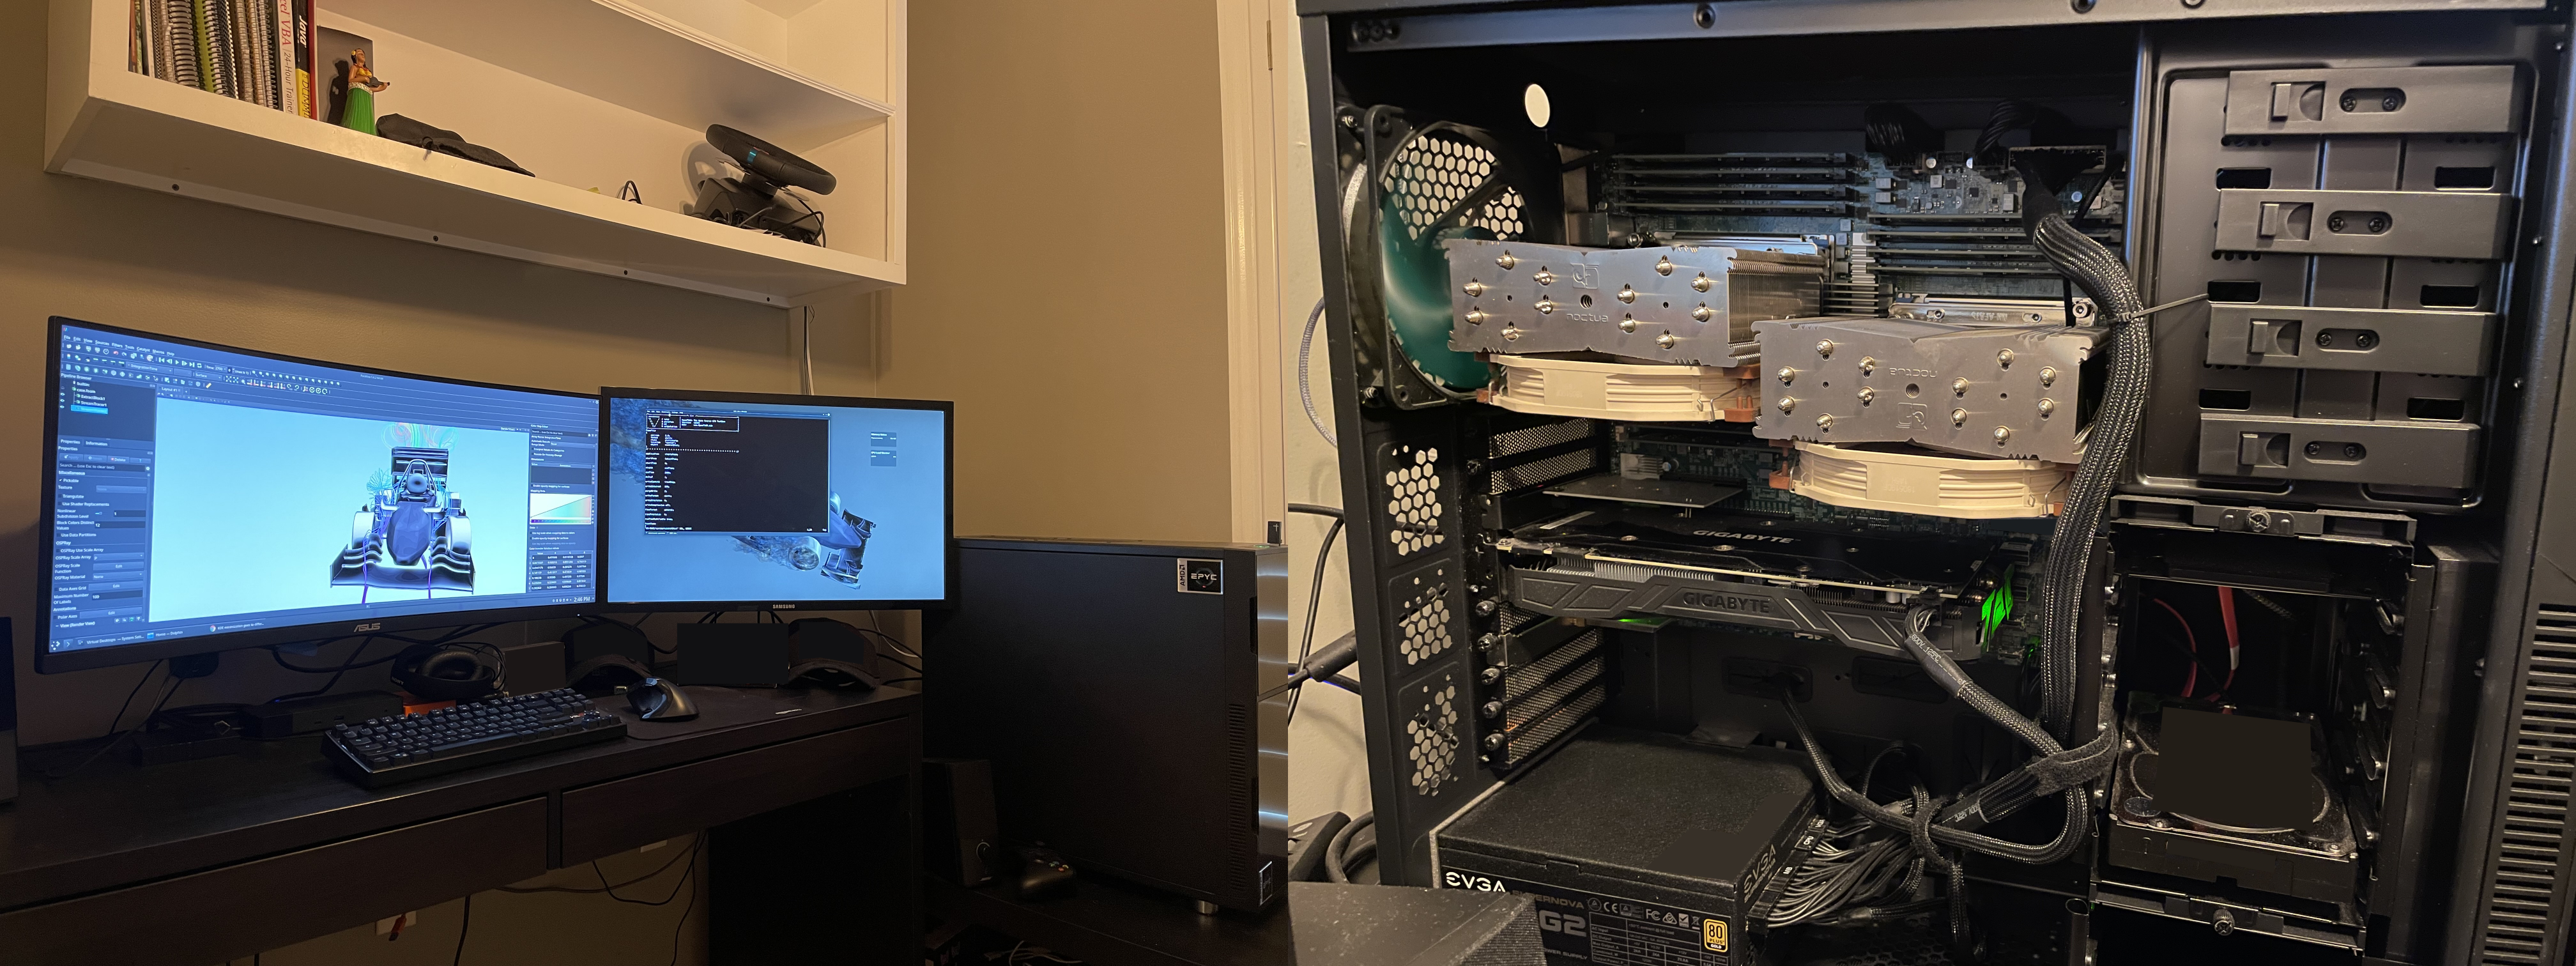
Home Server
I do all my work on a home server. I occasionally use it to game, but it’s specs more suitable for running CFD. I assembled it in late 2018, and it has two processors with 16 cores (32 total). The massive amount of memory bandwidth that AMD Epyc processors offer make industry level CFD accessible to high-end desktops.
